


How to link Engagement to Business Performance in 3 Steps

We all know that engaged employees work harder and make fewer mistakes. Employee engagement is, therefore, one of HR’s best-known metrics. Because it is so important, many HR policies focus on improving this key performance indicator.
However, the big question is: is it worth it? This article will explain how you can find out whether engagement will lead to better bottom-line performance.
But first, let’s start off with the science. Why is engagement so important for organizations and how does it influence performance?
Employee engagement: The Science
Engaged employees are more actively involved in their work, pay attention and effectively tackle challenges to reach their goals. Also, they are resilient, find their work meaningful, work longer hours and are more immune to stress.
Everybody wants their employees to be engaged. However, there is a problem. Only 32% of the U.S.’ labor force is engaged. Interestingly, managers and executives are the most engaged.
Maybe this is related to age as employee engagement increases with it. Millennials are the least engaged (28.9%), while people in their fifties and older are much more engaged (37%; Gallup, 2014).

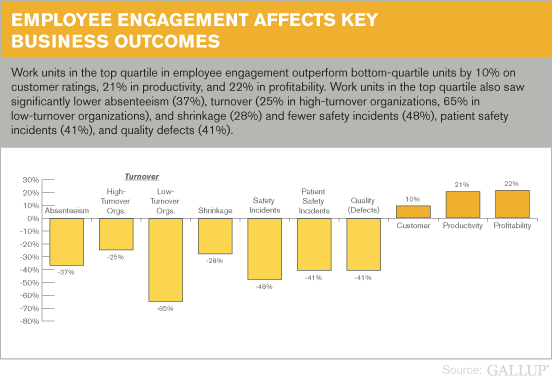
Engagement directly impacts critical business outcomes like absenteeism and turnover. Research amongst teachers shows that engaged teachers take 10 sick days a year. Non-engaged teachers (let’s call them ‘neutral’) take 11 sick days. However, actively disengaged teachers take 20(!) sick days a year (Gallup, 2014). This is cause for concern since only 30% of teachers are engaged.
Some additional numbers: Engaged workers are absent less often (-37%). They are involved in fewer incidents (-49%) and quality defects (-41%). At the same time, they show 10% higher customer ratings, 21% higher productivity ratings and 22% higher profitability ratings (Gallup, 2012). I bet this heavily impacts bottom-line performance!
HR and Engagement
HR has been able to consistently produce the employee engagement metric. Organization-wide engagement is often seen as an important HR indicator. Companies such as Philips and Unilever report engagement numbers in their annual reports. Because of its impact on the workforce, it does not come as a surprise that many HR policies focus on improving this one KPI.
However, two questions remain. First, what is the real value of engagement? And, are investments in engagement worth it? In other words: what is the return on investment (ROI) in dollars for a 1-point improvement in engagement for your organization?
These are questions we have to answer in order to understand engagement. In this blog I will take a 3-step approach to answer the question, “Does employee engagement really lead to better bottom-line performance?”

1. Defining the right question
We want to answer the following question: “Does engagement lead to better performance?”
Before we start our analysis, we need to accurately define what data we need. If you use the wrong data you end up answering a totally different question. If you think statistics are a tad boring (it’s not!) you should skip the first two steps.
- Decide your level of analysis
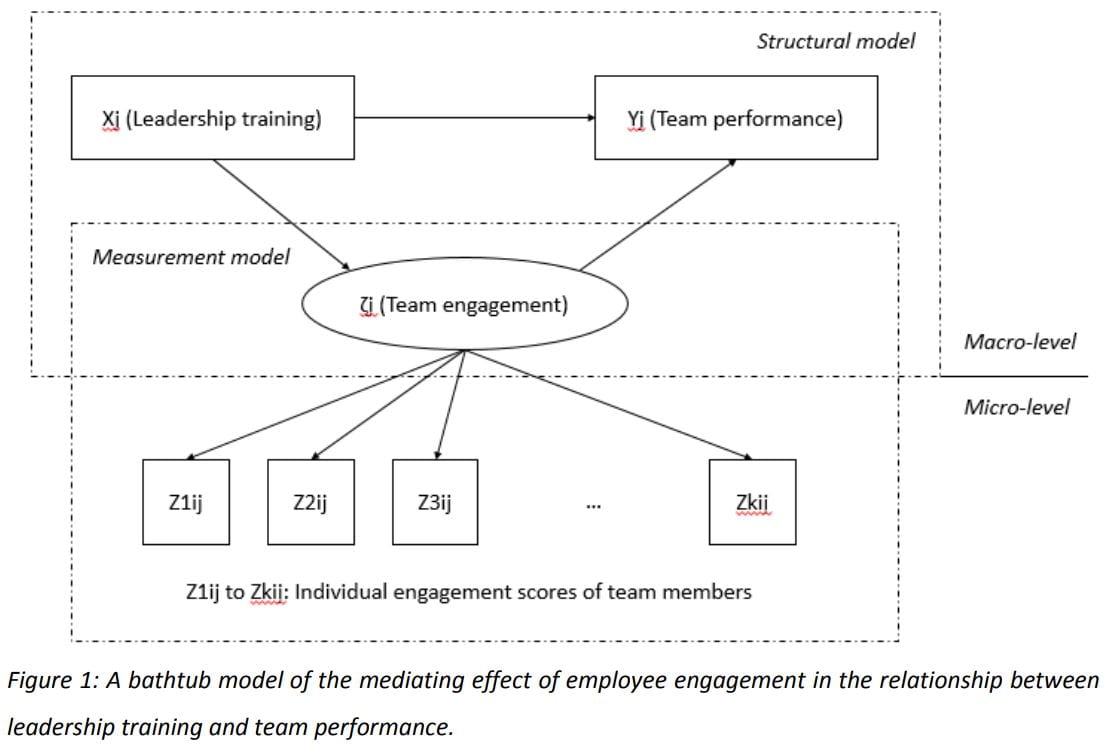
The engagement question can be answered by looking at various levels. These are so-called “levels of analysis”. You can look at individuals and their individual performances, teams and their team performance, and at the organization as a whole.Each level requires different data. For example: when you look at individuals, you miss information about their team and surrounding. Literature shows some proof that disengagement can be contagious. A five-person team consisting of four very engaged employees and one disengaged employee will most likely perform differently than a team of five moderately engaged employees, even though the average engagement score of both groups is more or less the same.The one disengaged team member will negatively affect the performance and work ethic of the rest of the team. This is because they lack the synergy of similar engagement. Indeed, over time the other four members are expected to become less engaged because disengagement is contagious (more so than the other way around). These intricacies are missed when you look at the group level alone, but they do play an important part.This is why your ‘level of analysis’ is important. An advanced statistical technique to analyze subtle patterns in data at different levels of analysis is a bathtub model (van der Laken and colleagues, 2017).
Click to enlarge You would preferably start at the level with the most specific data. Many companies conduct yearly engagement surveys for their entire population. This means that the individual level provides detailed information and this makes it a good place to start your analysis.However, sometimes individual data is hard to get your hands on. We will discuss this in more detail later in the article. - Decide how you define performance
We know we will use individual employee engagement data as input. Now, what would be a good data-source for our outcome (or dependent) variable?One option to use as an outcome is to use organization-wide financial performance measures. This information is available in the finance department.Using organization-wide financial performance data is rather tricky. In our example, it would mean that you would try to relate individual engagement data to organization-wide performance. This way you would miss intricacies and dynamics that happen within groups and between groups in the organization. These are dynamics that are not really measurable. In other words, these effects will act as a set of potentially very strong confounding variables in our data.Another option is to measure manager-rated individual performance. This is usually available in your performance management systems. However, performance appraisal data is oftentimes subjective. This is why companies such as Deloitte, Adobe, and Accenture stopped doing them.Taking this subjective data as an outcome measure can skew the conclusions of the research. In fact, if you formulate an answer using this data, you will most likely answer a different question.In other words, all these data sources have serious limitations when it comes to answering the question how engagement enhances performance. So, how do we fix this? - Start with small and specific analyses
One way to fix this is to do it lean and start with a number of small experiments.Engagement will lead to different outcomes, depending on people’s work. You can, for instance, take the employee engagement data of your sales people and compare them to their individual sales numbers. This will provide you with insight into how an increase in engagement will impact your sales. A great first experiment which helps put a financial number on engagement.Sales metrics are important to sales departments. Other departments need different metrics. Take customer service employees. Comparing their engagement level to company sales will probably not tell you much. However, you will gain very useful information when you compare their engagement level to your customer satisfaction.These are small and specific experiments with tangible results that could have a big strategic impact. - Relate your findings to the bigger picture
Imagine you would find that the engagement of your customer service employees is related to customer satisfaction. In order to draw conclusions about bottom-line performance, you will need to take a few more steps.We all know that dissatisfied customers defect. They are likely to leave the company for a competitor – taking their money elsewhere. In other words, bad service and subsequent customer dissatisfaction are related to your company’s (recurring) revenue.Take small steps but keep the bigger picture in mind. This will help you relate your measures and experiments to financially quantifiable performance numbers. The figure below shows the hypothesized steps.
 Every organization has different performance benchmarks. Try to relate the most relevant performance metrics to engagement. This will differ per department. In addition, research how these outcomes are connected with performance and financial outcomes. As you saw in this example, it is not always a straightforward question.
Sometimes these performance benchmarks are not as clear-cut. For example, sales numbers can be quite unreliable. It can take years to make a big sales-deal. When a sales process is complex, there’s not much data available so it pays off to look at alternative measures.
For example, the number of contacts a salesperson has, or the number of calls he/she makes are more likely to be related to performance. These are measures are much more available and will thus help you say something about someone’s longer-term performance. More data equals higher accuracy in this case.
2. Measurement and data
You now know the question you want to answer. You also know what data you need. Do you know how you will use the data?
First, you will want to clean and structure your data. HR data is often stored in multiple systems. Oftentimes the same function has two or three labels, which makes it hard to analyze the data accurately. This is a time-consuming and tedious process which we discuss in more detail in our 6-step guide to HR data cleaning. Let’s assume that your data is crispy clean and ready to be analyzed.
Correlations
You have a list of the engagement scores of your customer service employees of a specific year. You also know the customer satisfaction ratings over that same year. The easiest way to analyze the impact of employee engagement on customer satisfaction ratings is to check for a correlation.
However, there is a problem when you present this finding to the Board of Directors. Every member with some understanding of statistics will ask the same question, namely: “Is the effect causal or correlational?”
Additionally, you will miss important elements when you perform a simple correlation. Factors like leadership, age, gender, tenure and so on, all influence the relation you are researching. By controlling for these variables, you can estimate the effects of engagement on customer satisfaction much more accurately.
SEM & regression analysis
Examples of more advanced methods are structural equation modeling (SEM) or regression analysis.
In order to prove causality, you need longitudinal data. This means that you need multiple measurements over time. With this data, you can prove that a certain increase or decrease of engagement in the first year will lead to an increase or decrease in customer satisfaction six months later. For example, a one point increase in engagement scores (measured on a 5 of 7 point scale) could lead to a three percent increase in customer satisfaction six months later.
Repeat this process for customer churn and recurring revenue. When done right, you have sufficient data to draw some initial conclusions (the statistics enthusiasts would want to apply some more analyses, e.g. a Sobel test to test for mediation).
3. Interpreting your findings
So, what do your findings really mean? After you find your answer, many more questions pop up. Are there other relevant financial outcomes? How does engagement impact the rest of the company? How can you make your employees more engaged? What other beneficial effects does engagement have? Are engaged employees happier and healthier?
Be prepared for these questions. You will get asked these and more as soon as you present your findings.
But the bottom line is: you achieved an awesome feat. You proved the relationship between employee engagement and bottom-line performance. The CEO and CFO would both love to know more about what is happening when people become (more) engaged. And you sure sparked their interest in people analytics.
I used this example in a previous blog about predictive analytics already: Best Buy found that a 0.1% increase in engagement leads to an increase of more than $100,000 in a store’s annual operating income. This result led Best Buy to conduct quarterly instead of a yearly employee engagement surveys (Davenport, Harris & Shapiro, 2010).
This is the impact of people analytics. You are not yet Best Buy, however, you did make a huge first leap!
Some practical tips
A lot of the writings about HR analytics focus on employee engagement. There are however a few drawbacks. The first is that employee engagement data is often collected through third-party organizations.
Related: 4 mistakes in measuring business performance
These organizations are usually unwilling to share the data on an individual level. Instead, they only want to share team data when there is a minimum of 7 or 8 people in a team.
Practically, this means that small teams need to be combined with other small teams. This removes a lot of subtle nuances that otherwise would have been part of the data. For example, the effect of the manager on engagement, or engagement on financial performance is therefore much harder to analyze.
What you’d ideally do is collect the engagement data yourself. You can guarantee that you will manage the engagement data confidentially – but that it is not anonymous. You need non-anonymous data to do a proper analysis.
Another practical tip is to always double check before you present your result. Also, think about interventions which help your company act on these results. As you have probably already experienced, most executives have a limited attention span. Make sure to spend time on developing actionable solutions for them. Do not bore them too much with your statistical wizardry.
For a more technical analysis on (automated) engagement analytics, check Raja Sengupta’s article on Employee Engagement Analytics: How to Do it and Add Value.
Conclusion
Ultimately, you will want to turn every intervention into an experiment. Every experiment should have the goal to get closer to calculating the impact of employee engagement on business outcomes.
This example has helped you to identify the real value of employee engagement. After applying the previous steps you should know its impact on different business outcomes and on bottom-line performance. This information helps to make fact-based decisions about investment in your employees. And the best thing? You should now have all the information to make a compelling argument to business leaders to invest in employee engagement!
Weekly update
Stay up-to-date with the latest news, trends, and resources in HR

Learn more
Related articles


Are you ready for the future of HR?
Learn modern and relevant HR skills, online
