How to Create a DEI Dashboard for Your Organization in 7 Steps

If you’re looking to expand your hiring efforts and build a more diverse workforce, a DEI dashboard can provide your HR and leadership team with useful insights.
In 2014, leading tech companies, including Apple and Google, began releasing annual diversity reports on their workforce. While these reports displayed an apparent lack of diversity in gender and ethnicity groups, a strong demonstration of transparency fueled a louder conversation and progress in this area across industries.
74% of global organizations have reported focusing on diversity, equity, and inclusion since the pandemic. 57% of these organizations are implementing diversity metrics and programs.
While many companies are raising their game tracking DEI, there’s a demand for more visibility and insight into these metrics. With that said, let’s dive into all you need to know about building a DEI dashboard.
Contents
What is a DEI dashboard?
Why do you need a DEI dashboard?
DEI dashboard considerations and best practices
What is a DEI dashboard?
A diversity, equity, and inclusion dashboard is an interface that provides companies with a visual representation of their current diversity, equity, and inclusion practices. For example, a DEI dashboard can show you the status of your workforce in areas including:
- gender,
- age,
- race and ethnicity,
- salary data,
- retention rates,
- neurodiversity,
- and more.
Data is presented through various graphs, charts, and other visuals that are simple to understand and can be viewed at a glance. An organization can then use the insights to inform their DEI efforts and actions.
Many companies, including large businesses and universities, use a DEI dashboard to gain a clearer picture of their diversity, equity, inclusion and belonging practices.
Why do you need a DEI dashboard?
It’s an easy-to-understand representation of the state of DEI at your organization
While spreadsheets, metrics, and surveys all serve a purpose, they can often be time-consuming and challenging to sift through and make sense of. A DEI dashboard eliminates the need for this. It provides HR and business leaders with clear data displayed through simple visuals that effectively communicate a story to them as your target audience.
To monitor and improve DEI
A DEI dashboard helps the audience understand the implications of the visualized data. They can make evidence-based decisions from these patterns and trends to improve diversity, equity, and inclusion practices in the organization.
For example, a DEI dashboard could help you answer questions like:
- Are we building an inclusive culture at our organization?
- Are we attracting, hiring, and retaining diverse talent?
- Do we have equitable compensation practices?
- Are we providing opportunities equitably?
- Do we have equitable promotion practices?
The answers to these questions can help you pinpoint where you need to take action most to improve.
To strengthen your company culture
An inclusive culture embracing a diverse workforce makes the people in your organization feel good and far happier to be at work. Deloitte found that inclusive workplaces are six times more likely to be innovative. They also have more than double the cash flow per employee as non-inclusive workplaces over three years.
Companies that welcome employees from diverse backgrounds and foster an inclusive work environment will see a boost in culture and creativity, innovation, performance, and much more.
To adhere to laws and regulations
Employers in the US and UK are not allowed to discriminate against their employees based on sex, race, age, disability, religious beliefs, or genetic information. Many other countries have similar laws in place to protect employees’ rights. This means that candidates must be hired, promoted, and dismissed based on character and competencies instead of any other external traits.
A DEI dashboard can help HR leaders improve their recruiting, hiring, and retention practices, treat all employees fairly and build a more diverse workforce.
DEI dashboard considerations and best practices
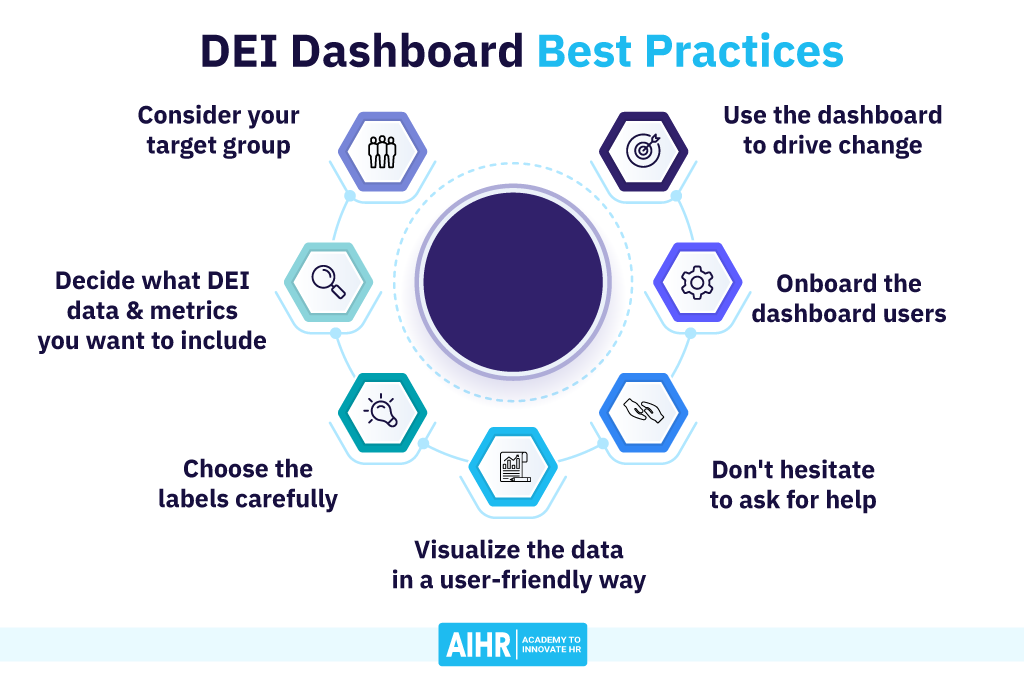
When creating your DEI dashboard, you need to make sure that it will be able to serve the purpose it’s built for. Let’s have a look at some considerations and best practices for a DEI dashboard.
1. Consider your target group
The first step in creating a DEI dashboard is to consider who will use it and how they will want to use the data. Will it be your HR and TA teams, the senior leadership team, an external audience, or all three?
Building it for HR will help you integrate diversity, equity, and inclusion into HR processes, including talent acquisition, measuring and managing performance, and workforce and succession planning.
Creating a dashboard with business leaders in mind can help ensure DEI is flagged as a top priority and given the resources and attention it needs to improve and thrive.
Finally, building it for an external audience (for example, featuring it on your careers page) will help you be transparent about your progress with DEI and boost your reputation as an employer committed to DEI.
Once you know who will primarily use the dashboard, you can plan what data and functionality to include (e.g., year-on-year comparisons, etc.).
2. Decide what DEI data and metrics you want to include
One of the biggest challenges with DEI is selecting the most useful metrics to help your organization effectively monitor progress. This is tough particularly regarding inclusion due to its intangible nature. The metrics you choose must align with the short and long-term DEI goals of the business.
Here are some metrics you may want to consider including in your DEI dashboard:
- Employee status (full-time employees, part-time employees, contract workers, contingent workforce)
- Groups (gender, age, ethnicity, sexual orientation, disability status, veteran status)
- Salary data
- Talent flow (hiring, promotion, turnover, retention)
- High potential employees
- Employee engagement
- Discrimination claims
Including ethnicity data can show you where the most significant gaps are in representation across your global workforce and each function and department. Combining several group metrics can help you understand the representation of intersectional groups in your organization.
Similarly, talent flow metrics can help you analyze data through the recruitment journey for underrepresented groups. It enables you to identify opportunities to implement more inclusive hiring practices.
Compensation data can help you conduct a pay equity analysis, identify pay gaps between demographic groups, and minimize these.
Engagement metrics can provide valuable insight into how inclusive your employees believe your company is and how this affects their engagement, morale, and performance.
Again, the DEI metrics you include depends on who the dashboard’s target audience is. For instance, sharing information on high potential employees might not be relevant for your candidates, but is important for your HR team. They might want to use that data for succession planning.
3. Choose the labels carefully
Language is powerful. When using language to describe groups of people, it’s essential to practice thoughtfulness and opt for humanizing descriptions. For example, “international employees” sounds far more considerate and appealing than “non-resident aliens”. This is particularly important when labeling ethnic groups with a weighty history of discrimination and marginalization.
So, how can you ensure you select the most appropriate label for particular groups of people? Research how your employees perceive and refer to themselves through focus groups, and stay on top of appropriate research into this field.
4. Visualize the data in a user-friendly way
The next step in creating a DEI dashboard is to select a suitable tool to build it with. There are numerous options available, with Google Data Studio, Tableau, and Power BI leading the pack. Assess the solutions you’re already using in your organization—you might find they have built-in dashboarding functionalities.
In order to be actionable and have a strong chance of succeeding, the information needs to be readable by your target audience. For example, in 2011, The US Department of Agriculture moved from communicating healthy eating guidelines via a food pyramid to a plate model (because people eat off plates, not pyramids) and found this to be a roaring success.
Utilize colors, charts, graphs, and other relevant visualization methods to make your data and metrics clear and simple to digest.
It’s equally important that you can easily compare data between units and across periods. The London Organizing Committee adopted this approach for the 2012 Olympic and Paralympic Games, where they were tasked with the mission of hiring 200,000 people. Existing staff were given a monthly snapshot of the organization’s diversity metrics (including gender, ethnicity, and socioeconomic status), while senior leaders were given detailed monthly departmental reports, recruitment targets, and a benchmark.
Each month, every department was ranked based on their hiring record. That enabled the team to quickly identify patterns and change their approach if needed. This initiative resulted in the organizers achieving or surpassing all their diversity targets.
5. Don’t hesitate to ask for help
Building a DEI dashboard requires a certain level of digital and technical savvy. If you’re tasked with creating one and don’t have a dedicated people analytics team in your organization, consider reaching out to your data or tech team for help.
6. Onboard the dashboard users
To ensure your intended DEI dashboard users make the most of this tool, it’s essential to explain where they can find it, how they can access it, how to use it, and what they’ll gain. You can create a short introductory video or guide or organize a short meeting or training session.
7. Use the dashboard to drive change
It’s important to gather, visualize and present key data and metrics and then use them for insights and action.
For example, let’s say your DEI dashboard alerts you to the fact that while the overall share of your non-White employees is representative of the local population, this is not the case for non-White women. You can then delve deeper into this issue and determine where the problem arises. Are non-White women not applying for roles in your organization? Are they failing to pass your selection process? Or are they being hired but not retained?
Once you know what the specific problem is, you can resolve it through targeted HR initiatives.
To keep your DEI dashboard relevant, you need to update the data regularly. You can update the data monthly, quarterly, or annually. The frequency will depend on the size and needs of your organization, availability of data, and other factors. You also need to decide how you’ll do the updates. You can do this manually or pull the data from systems like HRIS or ATS.
DEI dashboard examples
If you’re looking for inspiration for what your DEI dashboard could include and what it could look like, check out the examples below.
Example 1
Example 2
This dashboard has been created with Real World Fake Data.
Example 3
A final word
A DEI dashboard is a way for companies to manage their work in diversifying the workforce and creating an inclusive company. Being intentional about what you include and educating the users on how to utilize it will help you ensure that your dashboard is more than just a nice visualization.
Weekly update
Stay up-to-date with the latest news, trends, and resources in HR
Learn more
Related articles
Are you ready for the future of HR?
Learn modern and relevant HR skills, online


